News + Resources

Filter by
All Resources
All Categories
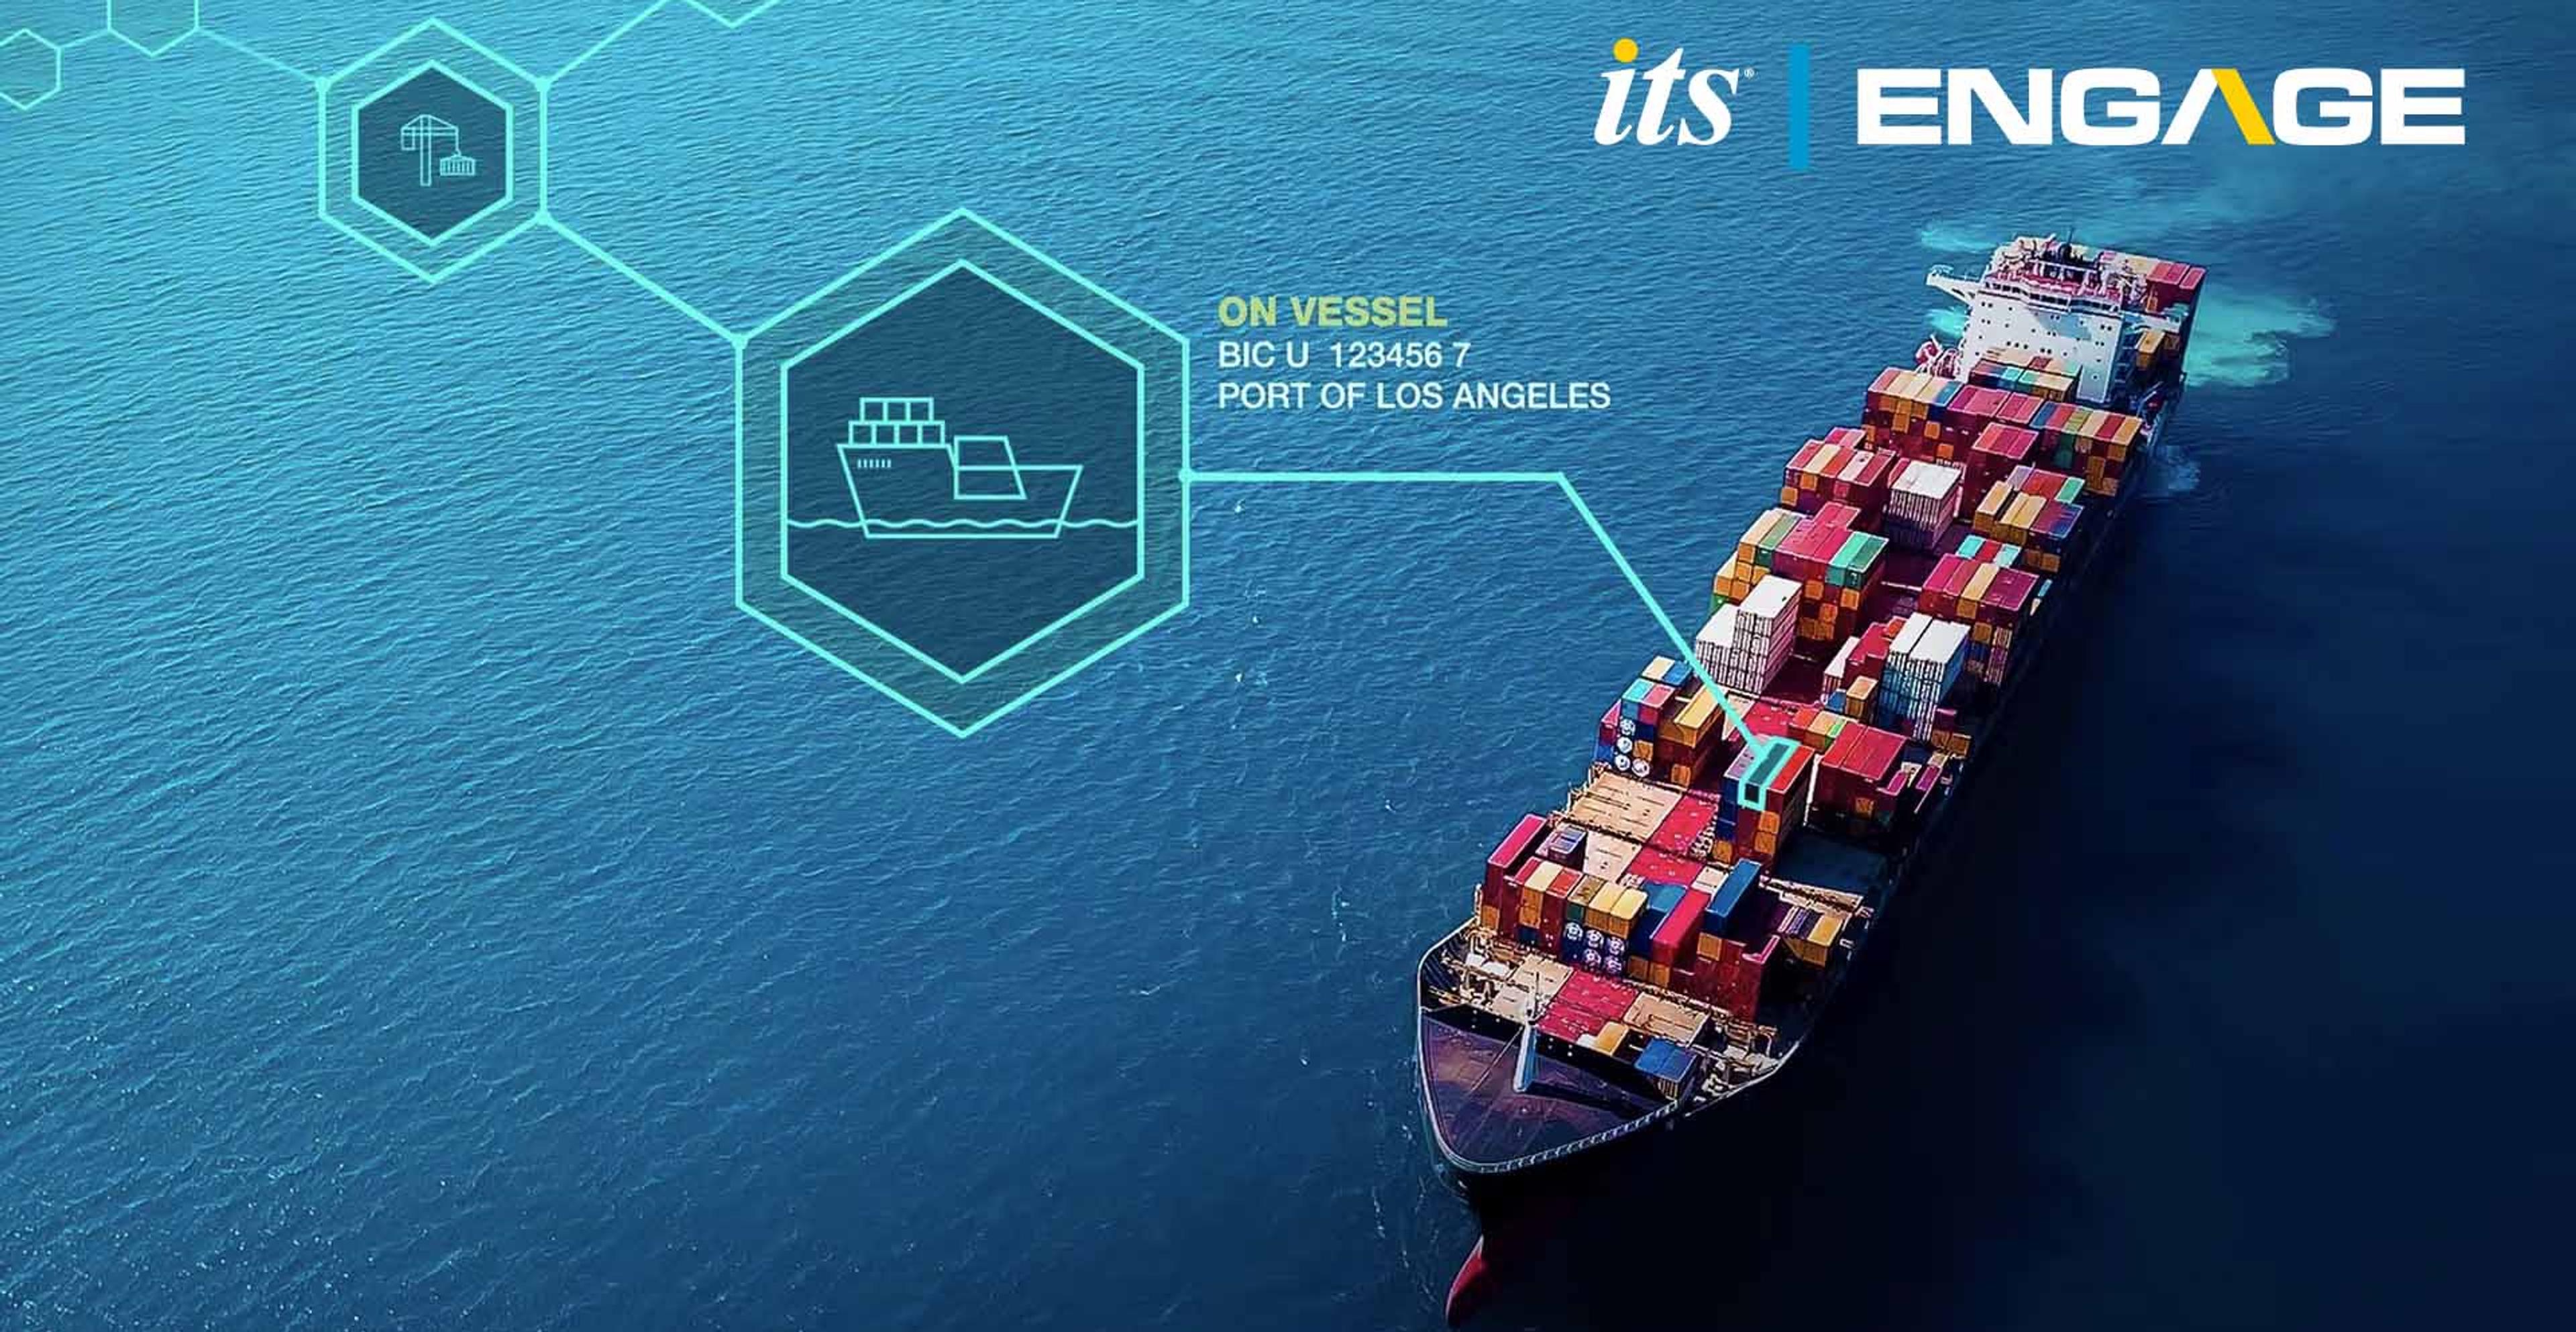
ITS Logistics Announces ITS Engage: A Centralized Ecosystem for Shippers, Carriers, and Supply Chain Partners
Press Release | Technology
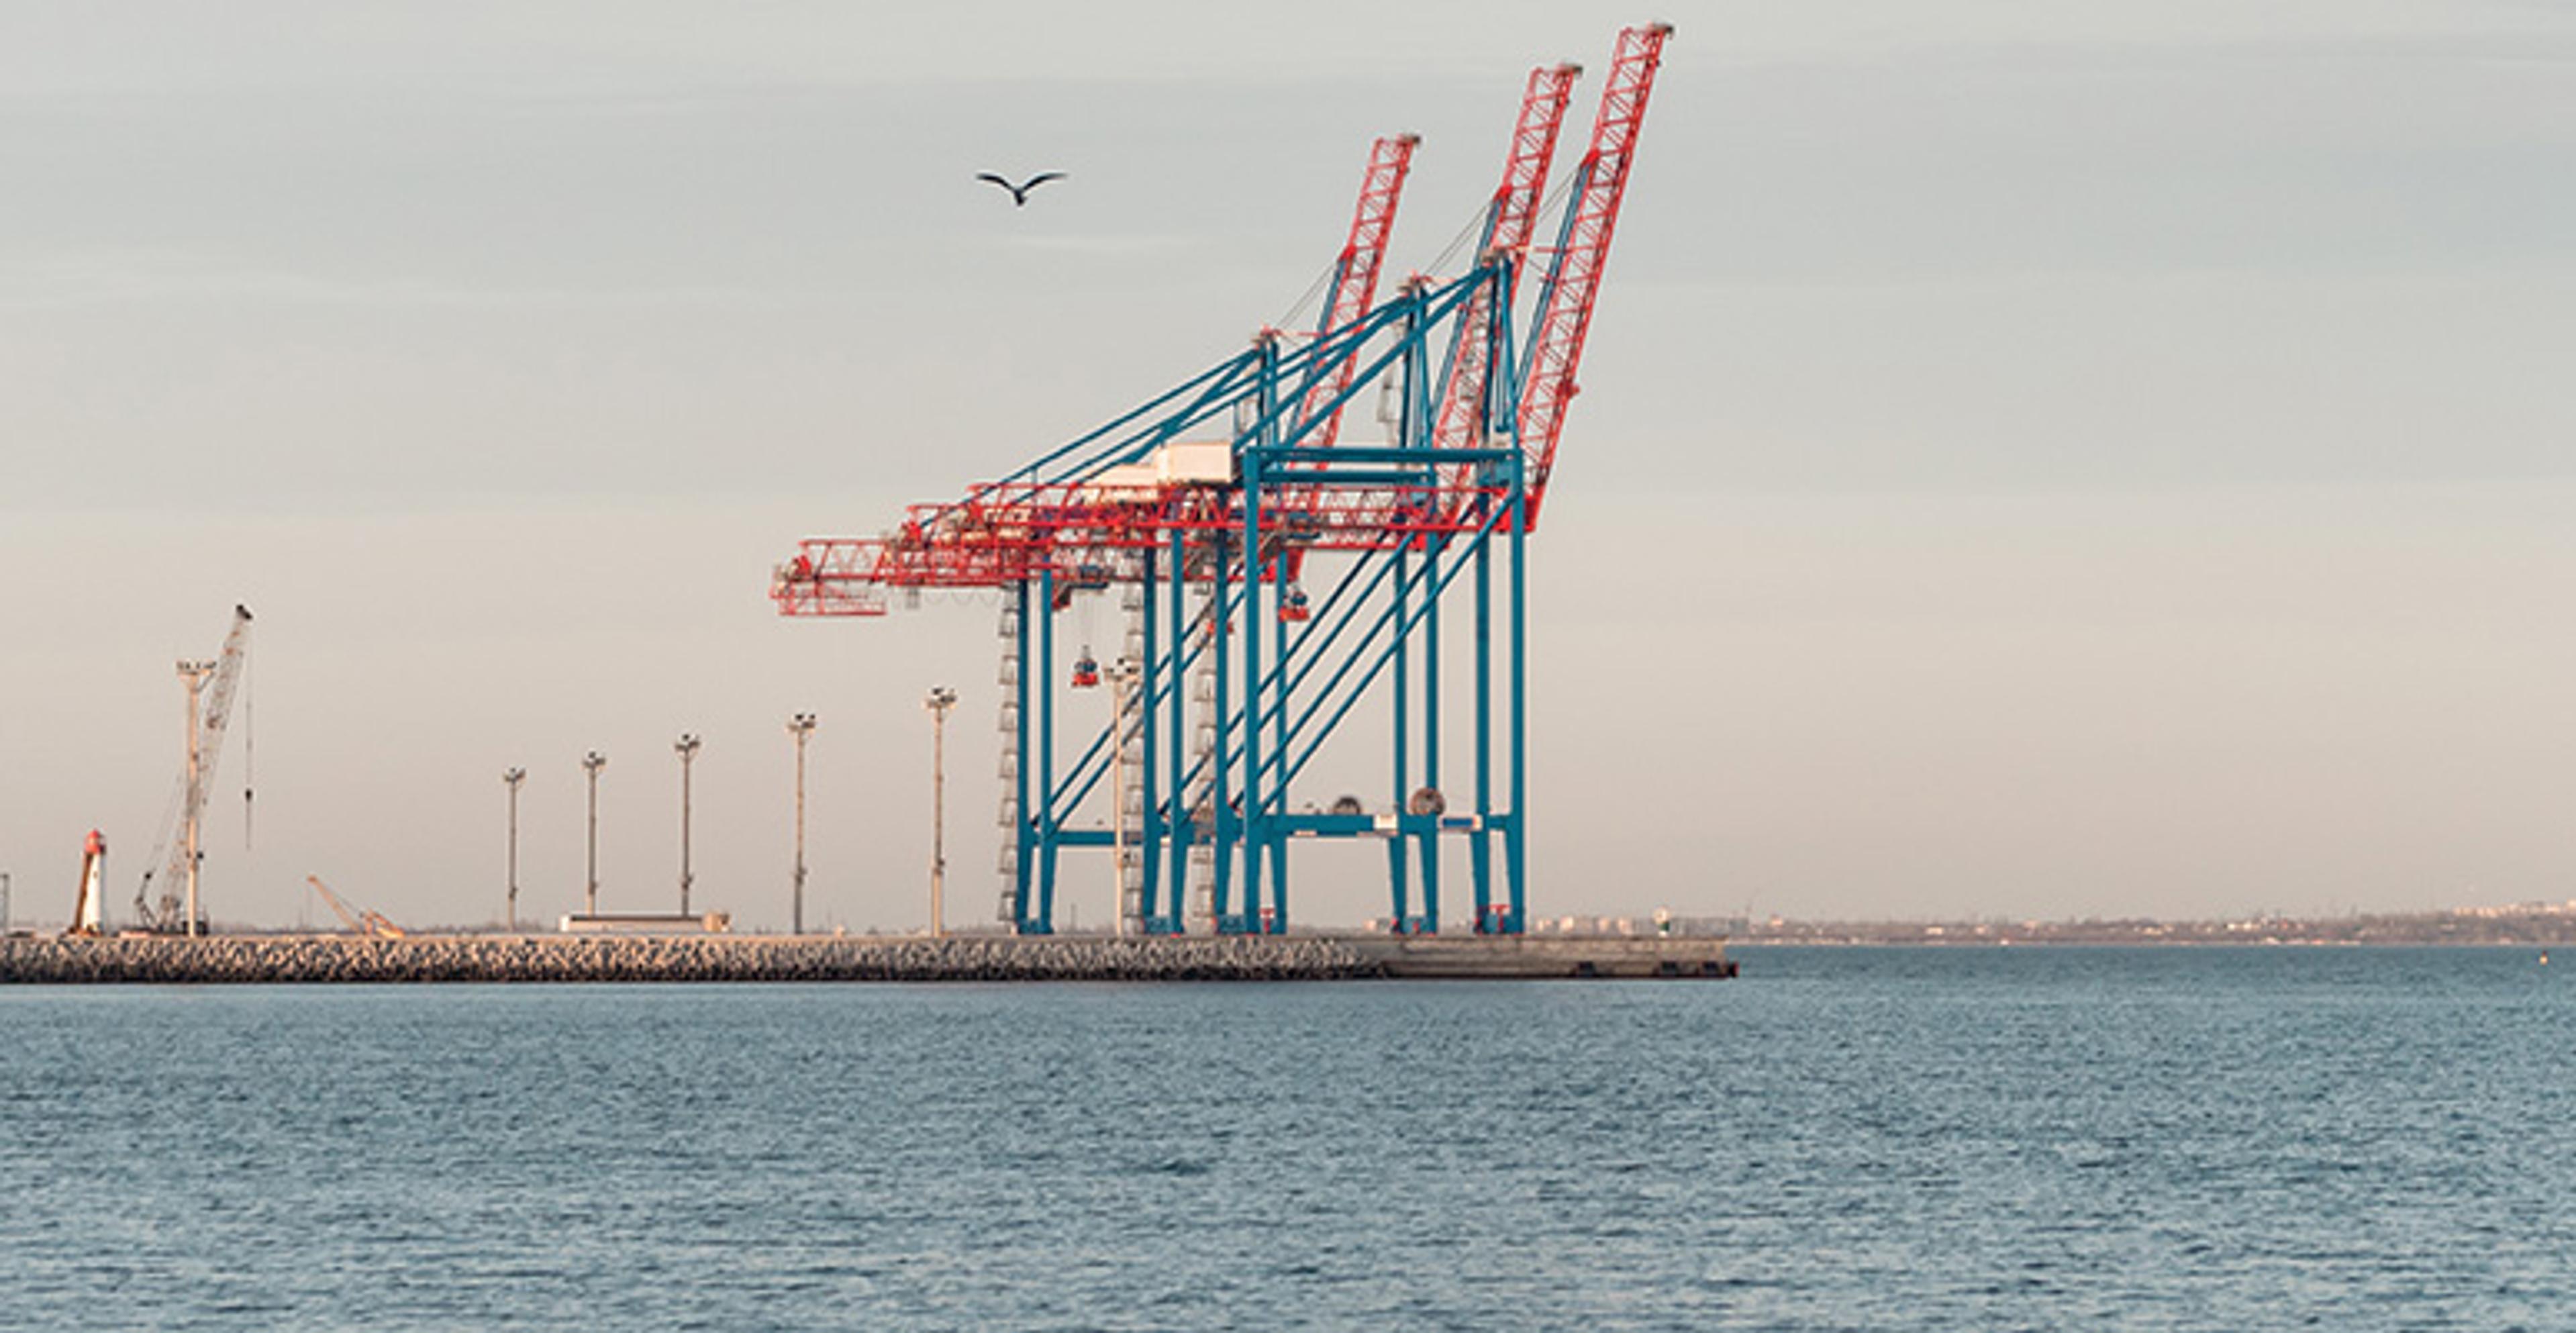
ITS Logistics June Supply Chain Report: Inventory Costs Increase as Port Container Volumes Sink to COVID-Era Lows
Market Update | Market Update
IN THE NEWS: Deep Inside US Economy, More Sticker Prices Start Going Up Due to Tariffs, and Inventory is Headed Down
Blog | Company News
ITS Logistics Named to Inbound Logistics' 2025 75 Green Supply Chain Partners List for Advancing Sustainable Supply Chain Practices
Press Release | Sustainability
ITS Logistics Launches National Food & Beverage Logistics Hubs to Advance US Supply Chain Performance
Press Release

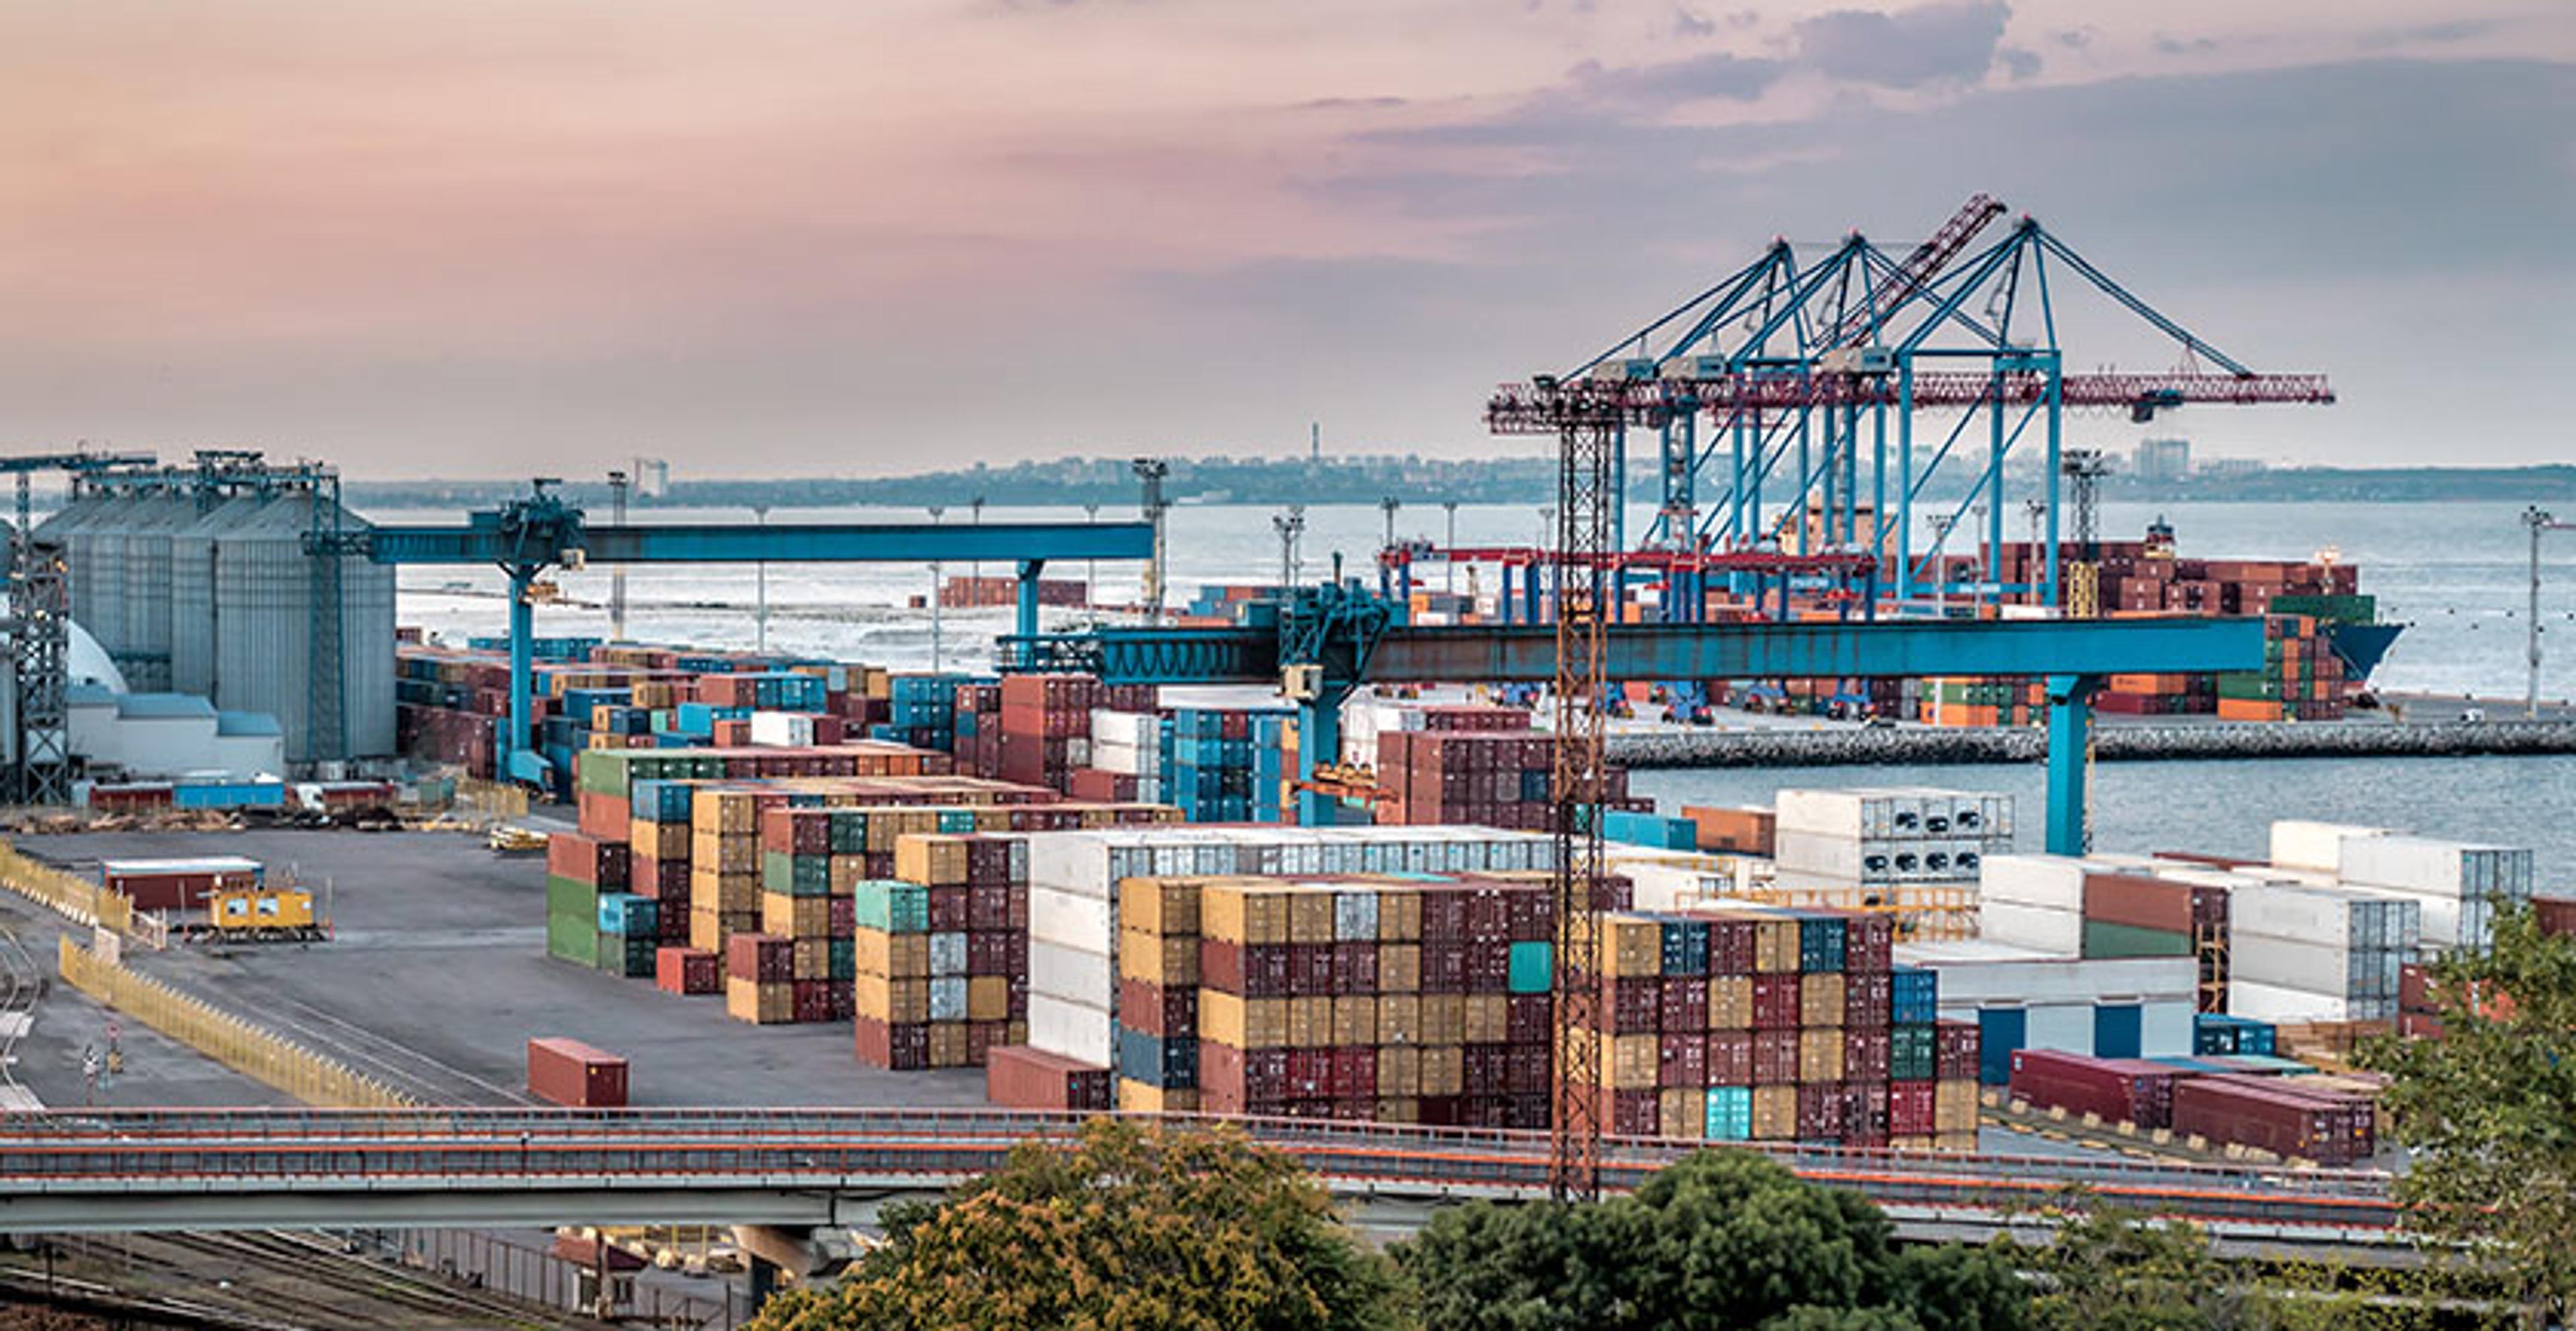
ITS Logistics June Port Rail Ramp Index: Trans-Shipment Delays in Asia Signal Impending US Import Surge, Spurring Early Retail Peak
Port + Rail Index | US Port/Rail Ramp Freight Index

…