New data sheds light on what is happening with US ports
As of December 2022, container rates into both United States coasts from North Asia have all but returned to pre-pandemic pricing. Supply chain experts are attributing the drop in rates to a handful of factors in addition to what is happening with US ports. Buyer sentiment has weakened in response to a softening economy. Warehouses remain overstocked from a volume boom in 2021 to early 2022 and increased carrier capacity came online to meet the volume demand.
Things have come a long way today since the early stages of the pandemic. Port congestion throughout most of 2020 and 2021 was strained as high demand was processed. Union negotiations and pandemic-related disruptions caused further issues, driving up prices and dwell times higher than the container market had ever seen. For example, just last year in 2021, the ports of Los Angeles and Long Beach had an average dwell time of 41 days. During the same time period, the Port of New York had an average dwell time of 61 days.
Lack of US port congestion relieves supply chain pressure
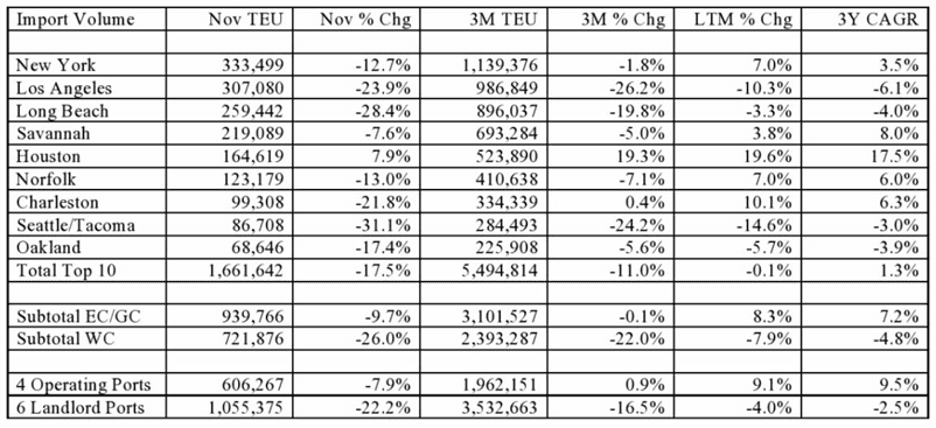
Congestion at US ports is effectively over, marking the first return to normalcy since 2019. The ten largest US ports saw a 17.5% drop in inbound container volume in November, a steep increase from October’s 10.3% decrease. The decline in November is likely the largest ever single month contraction. It also marks the third straight month of rapid year-over-year declines.
On the West Coast, ports experienced a staggering decrease of 26% in November. Labor unrest played a role in shippers shifting volume to eastward ports, especially in Houston. Ports on the East Coast and the Gulf had a 9.7% decrease in volume, which was also the first drop since the early months of the pandemic. New York remains the busiest US port for the fourth consecutive month, with 20.1% of volume in November 2022.
According to Hapag Lloyd’s latest quarterly report released in November 2022, worldwide container shipments are expected to grow by 1.1% in 2022 and 3.2% in 2023. In 2021, global shipments rose by 7.1%. Today’s shipment volumes are being compared as similar to the volume numbers from 2019.
Shifting from the West Coast port region to the East and Gulf ports
East and Gulf Coast ports have been consistently outperforming West Coast ports YOY growth rates. In late 2016, loads began to shift due to better water service economics from the opening of the expanded Panama Canal. The expansion allowed container ships three times larger to transit through the waterway, cutting down on shipping times.
Ports on the West Coast have been decreasing in volume in what is now a six-month downward trend. In addition to a decrease of 26% in November, October saw a 23.3% decrease. September, August, and July experienced a decline of 17%, 11.5%, and 5.1%, respectively. Beyond this data, the West Coast ports have also registered year-over-year decreases in eleven of the last fifteen months. The Los Angeles/Long Beach port specifically was down 28.4 % in November. Combined inbound volume in LA/LB is down 26% compared to the last year. East Coast ports currently handle 56.6% of inbound volume in the United States.
Coastal performance trends across the last three months (YOY) show that the East/Gulf Coast ports have consistently higher growth than West Coast ports. The pandemic plagued ports on the West Coast with congestion and equipment-related delays. This caused many buyers to migrate shipments to the East and Gulf ports to improve consistency of delivery timelines. Labor negotiations with the railroad union began mediation in June 2021, which led to additional shippers hedging volumes by shifting cargo east.
A long history of labor disruptions affects cargo movement
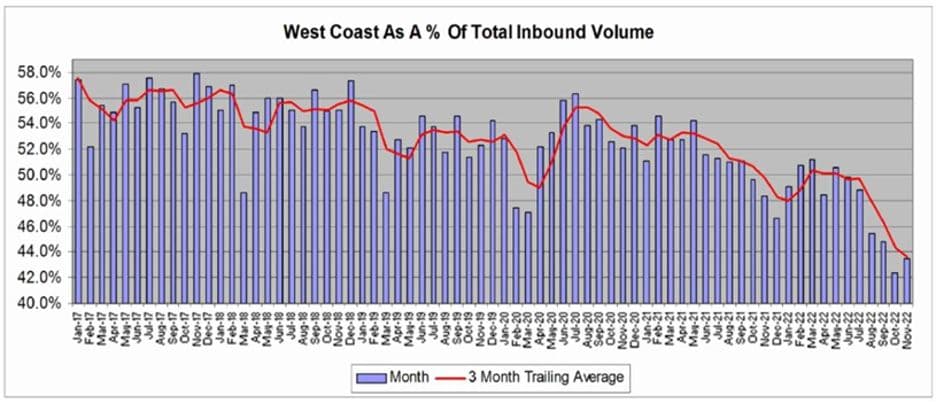
The shift away from the West Coast has been relatively consistent since 2016 and can be seen in the above graph. Contract negotiations between the ILWU and the PMA covering 29 US ports across the West Coast began in May 2014. The negotiations extended for nine months into 2015 before an agreement was made. The conflict led to six months of labor disruption and left an unprecedented number of ships waiting at sea to unload at port on the West Coast. The slowdowns were especially costly for agricultural exporters, whose produce rotted on the docks. Importers also felt the pain as they attempted get their goods on shelves in time for holiday shopping.
As time moved on, shippers did not forget about the costly port congestion resulting from the 2014-15 contentious contract negotiations. Soon after, they began diverting cargo to Gulf and East Coast ports. A more pronounced move occurred in mid-2021 and has been trending downward ever since. Some recovery can be seen from the low point in December 2021 throughout the start of 2022.
Investing in new port growth
US seaports, including Savannah, Georgia, the nation’s fourth-busiest container port, have spent more than a year dealing with a surge in imports. This surge was due to the traffic jams of container vessels lined up off the West Coast. The diversion of traffic led Savannah to handle a record 5.8 million container units of imports and exports in the 2022 fiscal year ending June 30. The volume was just under Savannah’s capacity of 6 million container units. While cargo has begun to subside, the port still saw its two busiest months ever in August and October.
The Savannah port authority plans to add capacity for an additional 3 million container units by 2025. The addition should give Savannah more breathing room in case a big influx occurs again. Savannah’s 200-acre Ocean Terminal currently handles most of Georgia’s breakbulk cargo such as lumber, paper, and steel. Those operations will be moved to the Port of Brunswick, about 70 miles south of Savannah. The terminal will then be converted to handling container imports and exports. The berths will be upgraded to service two large ships simultaneously using eight new ship-to-shore cranes. While the Ocean Terminal is under construction, a newly expanded cargo berth will open next summer at the main terminal.
As port congestion dissipates and more traditional seasonal patterns return, statistical data shows a high core growth rate of ports on the East and Gulf Coasts. The three-year CAGR in the chart below measures the East/Gulf Coast ports performance up 7.2% annually versus the West Coast ports down 4.8% annually. In addition to Savannah, Gulf Coast Port Houston is experiencing immense growth as distribution centers continue to invest in the region that is served by the port.
Choosing ITS Logistics as your port expert
With constant changes occurring at the ports affecting the supply chain, choosing a trusted logistics partner is more important than ever. The migration of cargo in US ports will continue to evolve. ITS Logistics has a footprint in 35 markets in North America and offers complete port/rail drayage solutions. Our team’s robust, dedicated operations learn your business from the inside out and make your problems our problems.
ITS is currently ranked as the #11 Top Intermodal/Drayage Carriers in North America by Transport Topics.
How can we help you?
Related articles
News + resources
What is Transloading, and How Can It Benefit Shippers?
Blog | Drayage + Intermodal
Transloading vs cross-docking, what’s the difference? Both connect trucks and trains for seamless freight movement, but each offers unique benefits. Here’s a quick rundown.
From Crisis to Collaboration: Everything You Need to Know About FLOW
Blog | Drayage + Intermodal
Learn more about FLOW, the federal program launched to improve supply chain visibility in North America.
A Comprehensive Guide to Intermodal Transportation
Blog | Drayage + Intermodal
Learn more about intermodal transportation, including strategies for overcoming diversions on the East and West Coasts, leveraging technology, and adopting sustainable practices.